You can start the visualizer from any contract or function page (see the purple button at the top).
Please contact the team (@andrewhong5297) if you have any issues, this feature is still in beta and may run into bugs and long loading times.
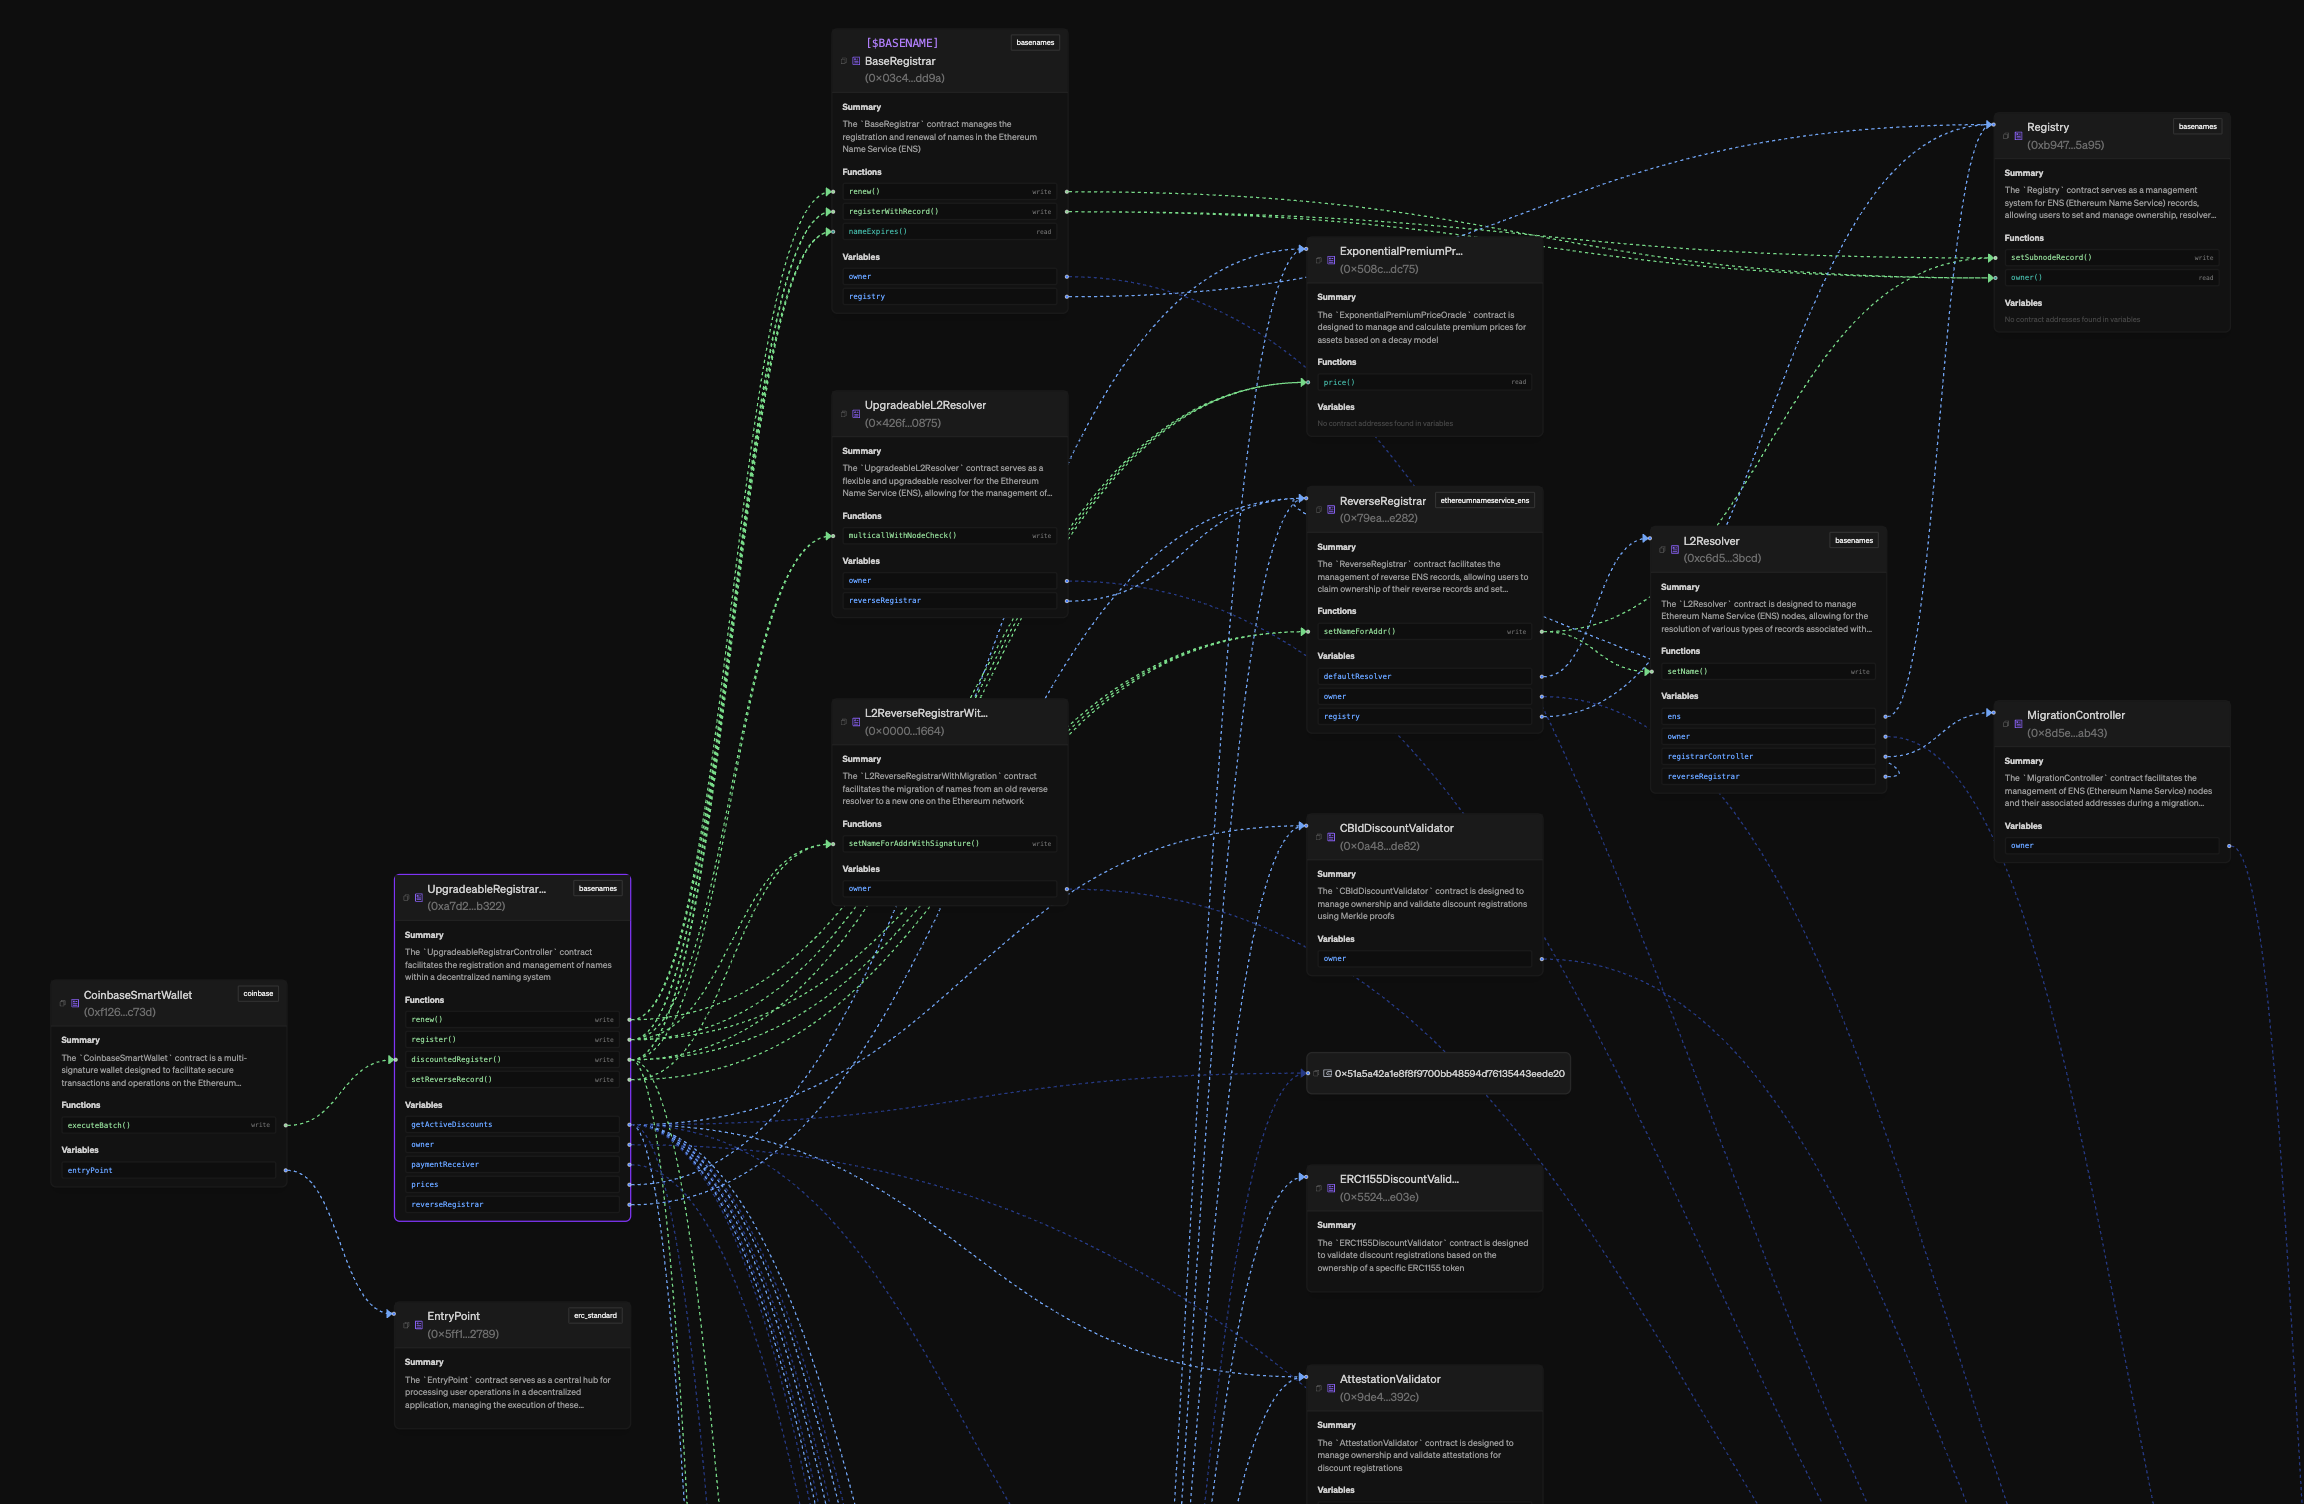
- Light Blue: variable referencing a contract address
- Dark Blue: variable referencing a wallet address
- Red: function that creates another contract (deploys)
- Light Green: write function calling another function
- Dark Green: read function calling another function
Exploring and Expanding the Graph
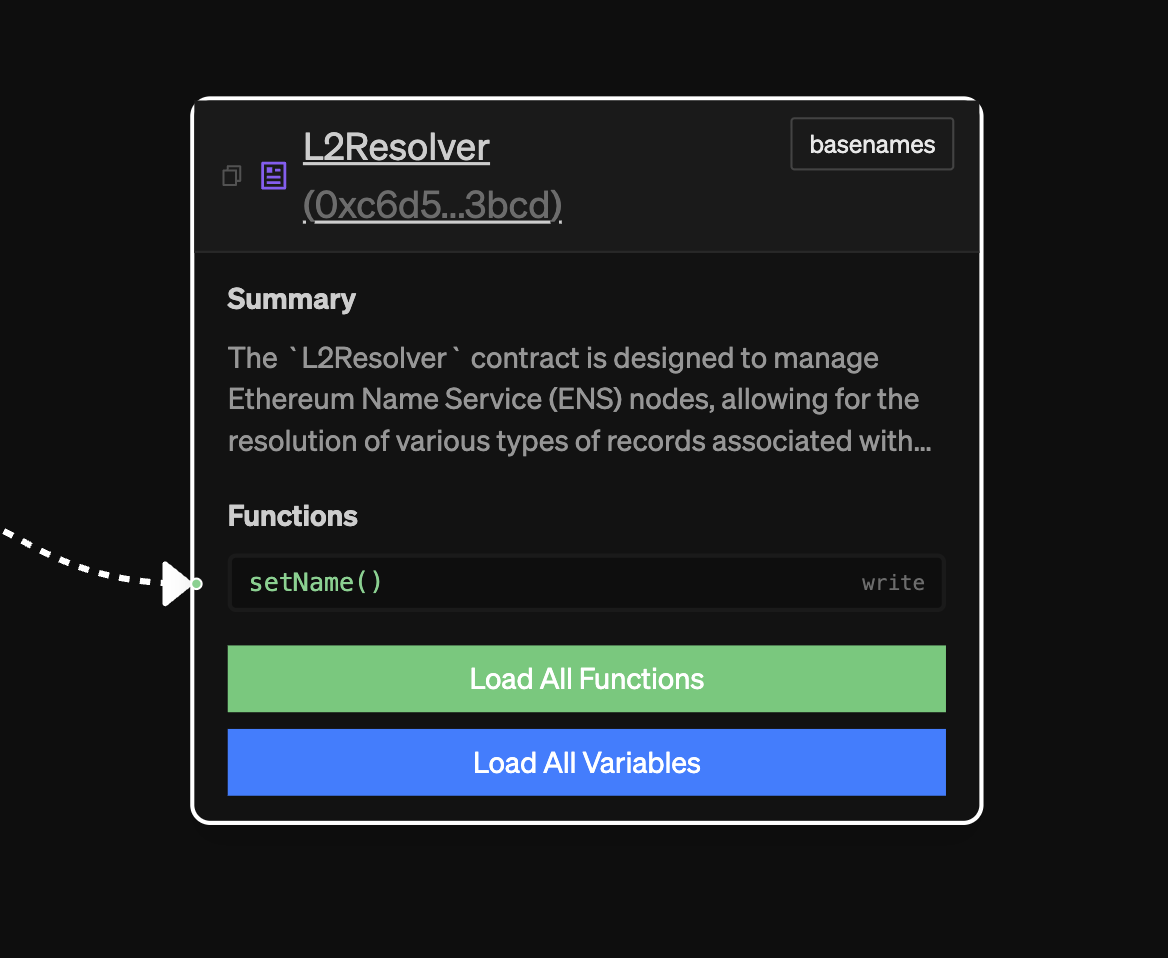
The node headers and each function/variable can be clicked to give you more details and link you to the explorer pages. You can also click on any function edge to see the transactions associated with it.
You can also use the sidebar to help you find where a contract/wallet is by hovering or clicking it there.
We currently have set limits around function expansion if 50 contracts exist already in the graph. This is for performance purposes. You can reach out to the team if this is really blocking you on something.
Visualizer Settings
In the top right of the visualizer, you’ll find four buttons for key graph settings:- “Collapse/Expand”: Collapsing will remove all functions/variables handles, showing just one line for every kind of relationship between nodes for a given node.
- “Functions”: This toggles if you want to show the function relations (green and red lines) or not.
- “Variables”: This toggles if you want to show the variable relations (blue lines) or not.